Mapicture has just helped another client with a catchment area analysis of three locations. Catchment area analysis are based on factual data on market fundamentals and helps to ensure the right decision to buy and develop property. So if you're a real estate developer, investor or want to sell a property, contact us to learn more about our catchment area analysis reports and data.

Mapicture ApS was founded in 2003 by Samo Olsen, Cand. Scient in geography. In 2013 our German subsidiary Mapicture GmbH was founded.
Interactive geographic visualization has always been part of our work. Since 2015, our focus has been on catchment analysis for retail real estate development. This has resulted in our software as a service - Sweetspot. A product we are proud of and are constantly developing.
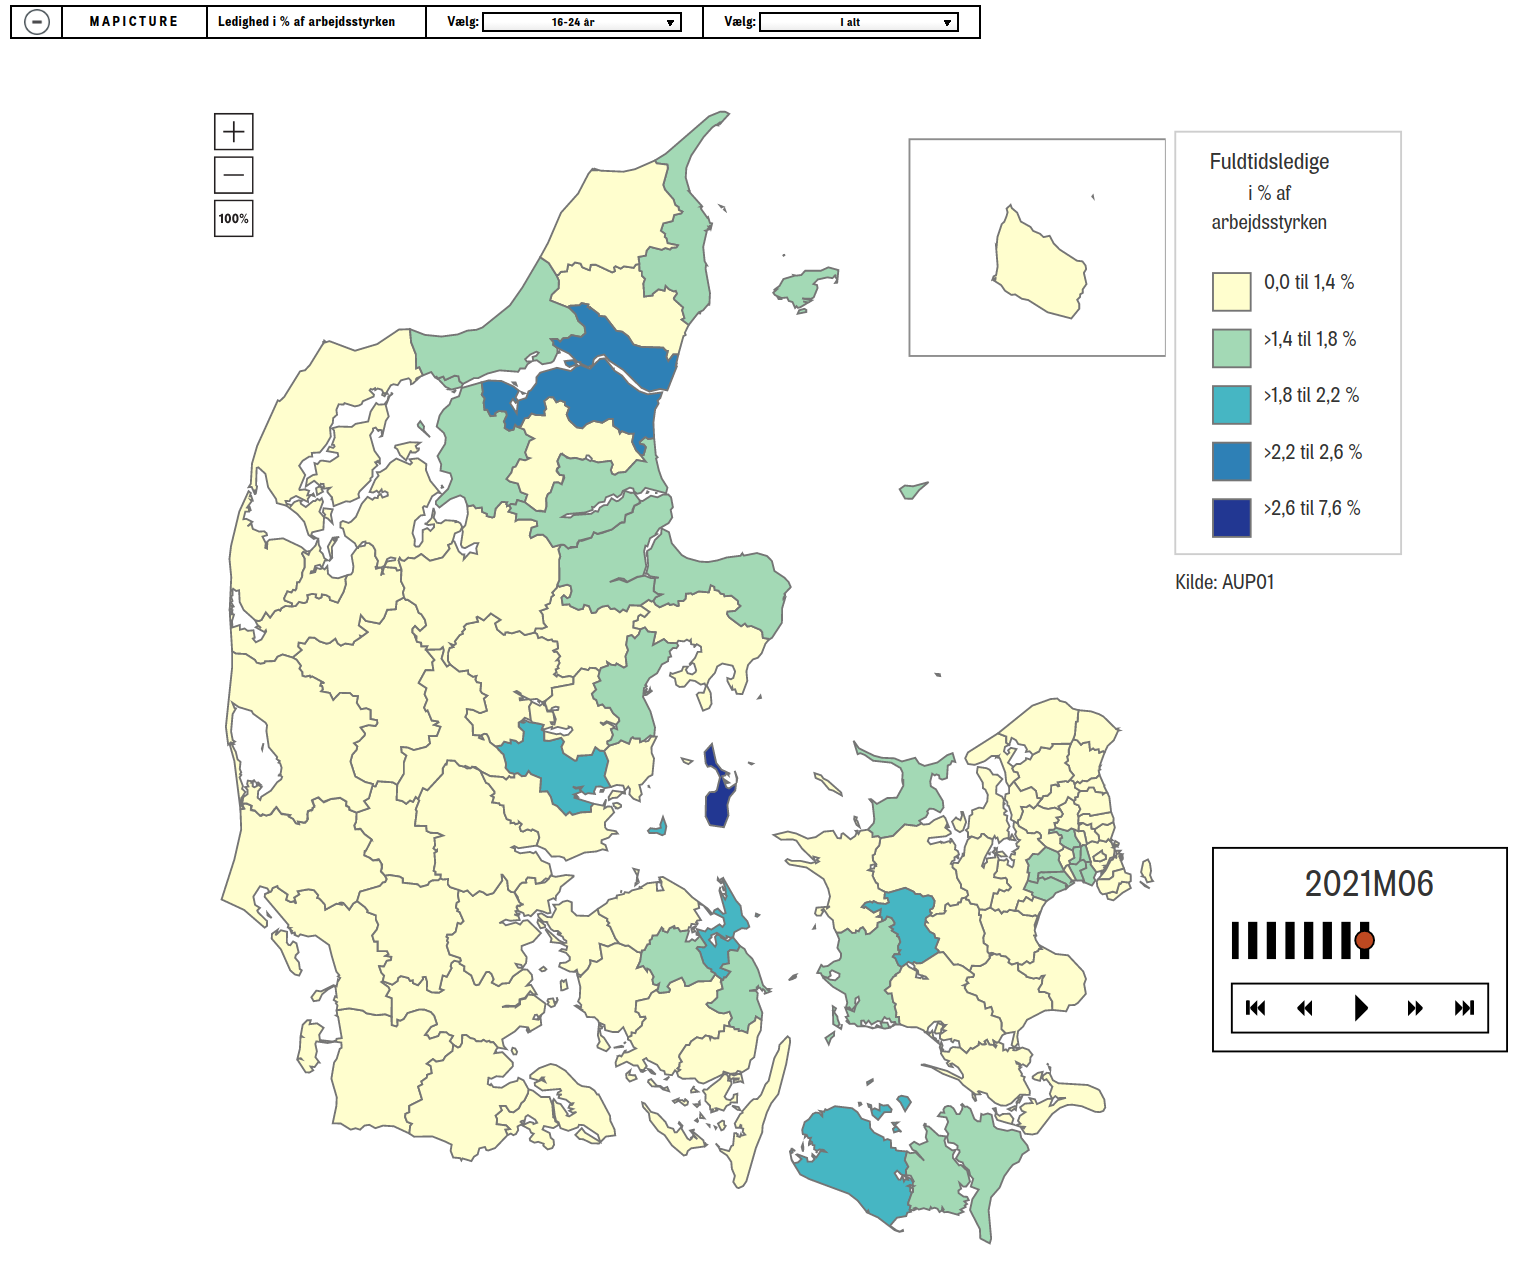
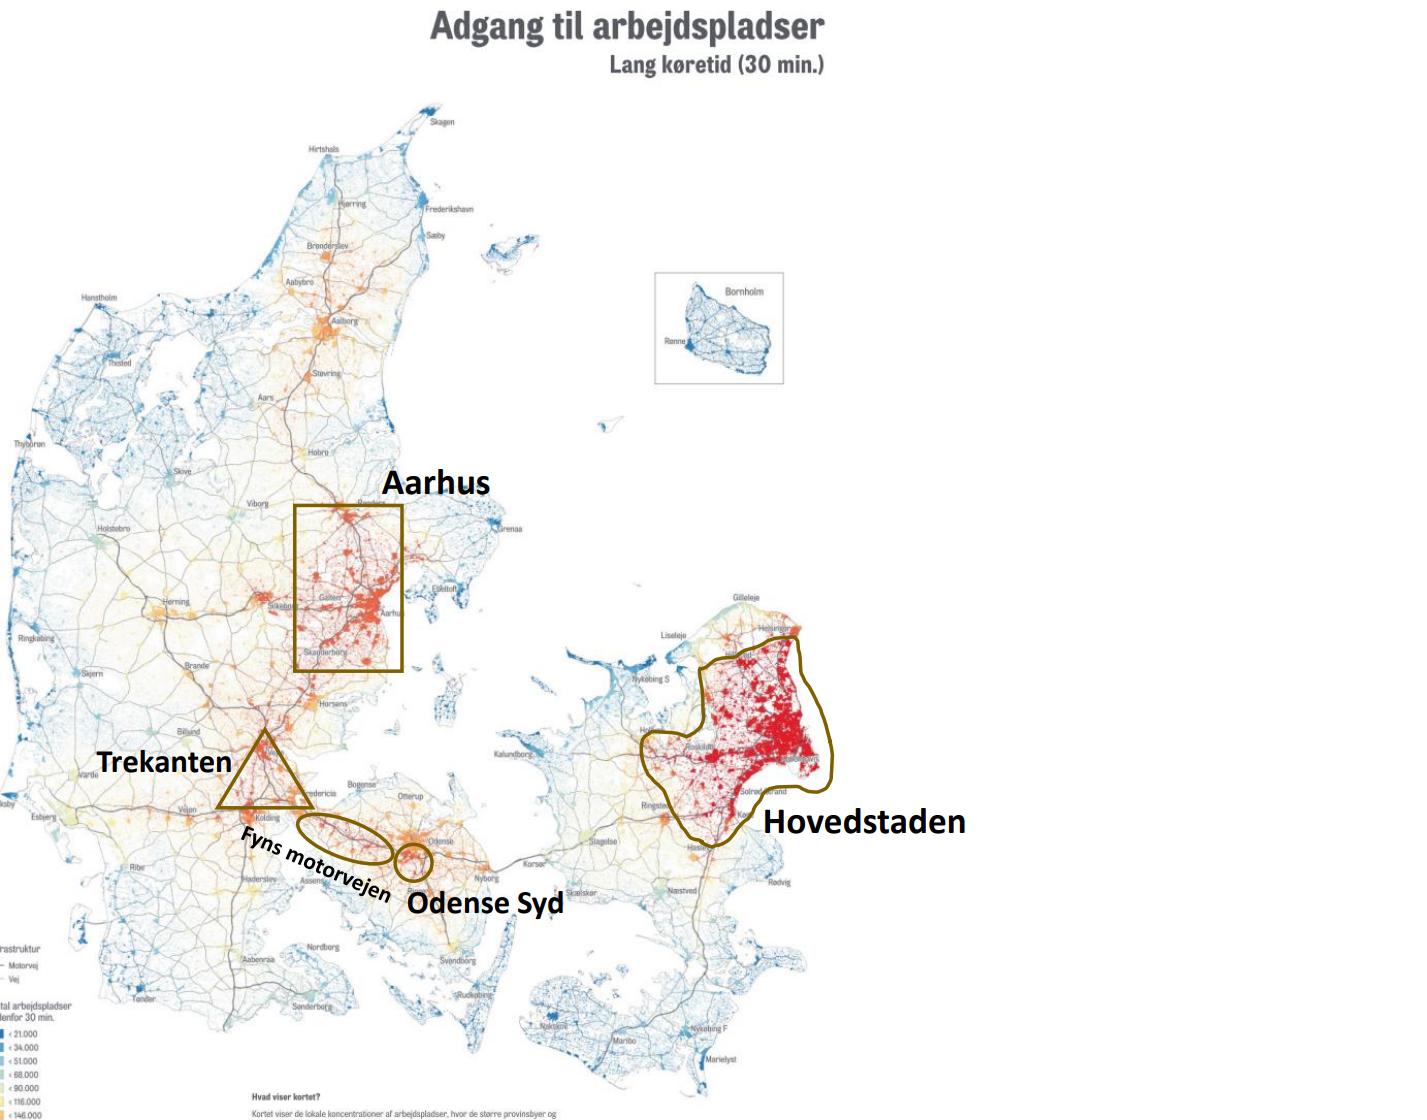
Geographic analysis in the form of thematic cartography (beautiful colored maps) is another area of interest and expertise. Over the years, we have produced several iconic posters on population development, urban sprawl, traffic, jobs and much more.
since 2015 we have been developing and improving our software as a service solution sweetspot. The solution is based on specific data on competitors' locations that are manually verified, data about customer rating, traffic, local plans, the building and housing register, the central business register, 100 x 100 meter square grid data about population, households and much more.
If you need a single catchment area analysis on a specific location we can do it for you on consultancy basis.